Question 6
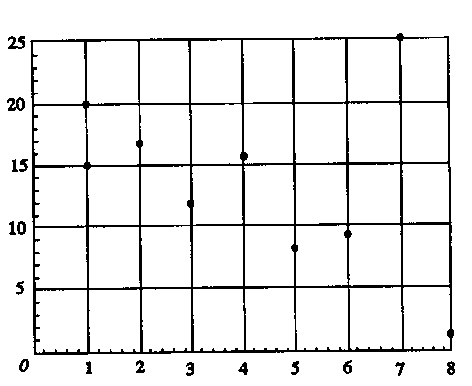
When the product moment correlation coefficient r was calculated for the data
displayed in the following scatterplot it was found to be -0.3951.
If the point (7,25) was replaced with the point (7,5) and the product moment correlation
coefficient r recalculated, then the value of r would be
A. unchanged
B. positive but closer to 1.
C. negative but closer to zero.
D. positive but closer to zero.
E. negative but closer to -1.
(1996 Further Mathematics CAT2)
Question 7
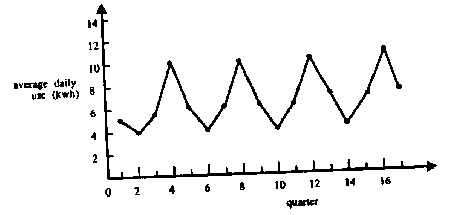
The time series plot shown represents the average daily use of electricity in a home in
successive quarters. The pattern revealed is best described as

A. seasonal
B. trend only
C. random
D. cyclic but not seasonal
E. seasonal with trend
(1994 Further Mathematics CAT2)
Question 8
The following table gives the number of births in a country hospital for the period 1980
to 1987
| year |
1980 |
1981 |
1982 |
1983 |
1984 |
1985 |
1986 |
1987 |
| number of births |
99 |
74 |
88 |
103 |
92 |
110 |
109 |
118 |
Using the three term moving average method, the smoothed value of the number of babies
born in 1984, to the nearest whole number, is
A. 92
B. 94
C. 99
D. 102
E. 104
(1996 Further Mathematics CAT2)
Question 9
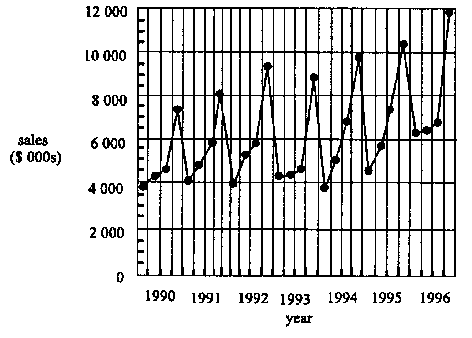
The time series plot shown here is best described as showing

A. random variation only.
B. an increasing trend only.
C. an increasing trend with seasonality.
D. seasonality only.
E. a decreasing trend only.
(1997 Further Mathematics CAT2)
Question 10
Ice cream sales for 1994/5 and the seasonal indices for an ice-cream maker are shown in
the table below.
| |
summer |
autumn |
winter |
spring |
| ice cream sold (1994/5 litres) |
29 465 |
20 875 |
18 187 |
19 345 |
| seasonal index |
1.30 |
1.08 |
0.79 |
0.83 |
When deseasonalised, the amount of ice cream sold in winter is, to the nearst litre
A. 14 368
B. 18 187
C. 19 345
D. 21 968
E. 23 022
(1995 Further Mathematics CAT2)
Question 11
Which of the following sequences is generated by the difference equation tn
= 2tn-1 - 6
with t0= 6?
A. 6,0,0,0,0
B. 6,6,6,6,6
C. 6,12,6,12,6
D. 6,0,-6,-12,-18
E. 6,12,18,30,54
(1996 Further Mathematics CAT2)
Copyright Information:
This material is an extract of material produced by the Board of
Studies, Victoria, Australia. This material is copyright and cannot be reproduced in any
form without the written permission of the Board of Studies.
Visit Board of Studies Website for more
information on VCE.
