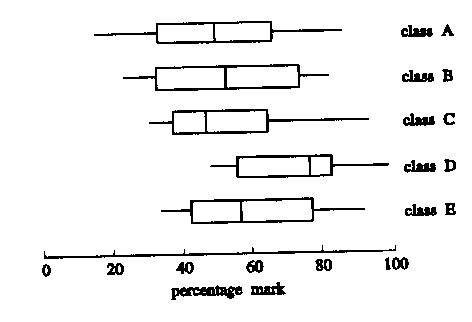
From the boxplots, the class with the largest interquartile range is
A. class A
B. class B
C. class C
D. class D
E. class E
(1994 Further Mathematics CAT2)
Question 2
Packets of Bublo bubble gum contain basketball cards showing the six top Australian
players for 1996. Each packet contains a single card. A student decides to use
simulation to estimate the mean number of packets of bubble gum that would need to be
purchased to get a complete set of the cards. To do this, she throws a fair die
until each of the numbers 1 to 6 have been thrown and records the number of throws. She
then repeats the process a further four times with the following results.
| trial |
result |
number of throws |
| T1 |
4 3 1 1 2 5 2 2 1 5 2 2 2 6 |
14 |
| T2 |
1 1 1 4 6 5 1 5 2 2 5 2 3 |
13 |
| T3 |
1 1 2 6 4 1 3 4 1 2 6 5 |
12 |
| T4 |
1 5 1 6 2 3 2 6 2 3 5 2 6 6 5 2 1 1 3 5 5 4 |
22 |
| T5 |
4 6 6 3 1 6 6 6 4 6 3 4 5 1 3 4 1 5 2 |
19 |
From these data, the student would estimate the mean number of packets of bubble gum
that would need to be purchased to get a complete set of six cards to be
A. 6
B. 12
C. 13
D. 16
E. 80
(1996 Further Mathematics CAT2)
Question 3
The distribution of the weight of ice cream served in a single scoop of Danish Delight is
known to be bell-shaped with a mean of 104gm and a standard deviation of 2gm. The
percentage of single scoops of Danish Delight containing less than 100gm will be closest
to
A. 0%
B. 2.5%
C. 5%
D. 16%
E. 95%
(1997 Further Mathematics CAT2)
Question 4
Market researchers found that, for VCE students, the value of the product moment
correlation coefficient between the number of hours they studied and their weekly
expenditure on junk food to be r = 0.64. From this, it could be concluded that
A. 64 percent of the student buy lots of junk food and study for long hours.
B. buying move junk food helped the students study more.
C. buying move junk food helped the students study less.
D. the students who spent more time studying tended to buy more junk food.
E. the students who spent more time studying tended to buy less junk food.
(1995 Further Mathematics CAT2)
Copyright Information:
This material is an extract of material produced by the Board of
Studies, Victoria, Australia. This material is copyright and cannot be reproduced in any
form without the written permission of the Board of Studies.
Visit Board of Studies Website for more
information on VCE.
