[Home][General][Business][Engineering][VCE][Learning Units][Tool Box][Glossary]

mcalogo.jpg (3090 bytes)

Graphs
Quadratics
Examples
Have a Go
Practice Questions


Back to
Graphs Units

A quadratic relationship(quadratic expression) is recognised by the x2 term in the expression. The simplest equation for a quadratic is y = x2 . A quadratic relationship between two variables gives a graph of a  parabola. The shape of the parabola depends on the quadratic expression. Some examples of quadratic expressions are: 

  x2 + 2;     -2 x2 + 3x - 2;    a2 + 2a - 3 ;     x2 -5x + 4;  
  - x2 + 2x + 3 ;    5m2  - 2m - 3 

In these expressions, the highest power of the pronumeral is 2.
Note that x3 + 2x2 + 2 is not a quadratic expression, because in this expression the highest power of the pronumeral is 3.

In linear expressions,
the highest power of the pronumeral is 1.
For example
2x + 3,    3m - 1,   3x - 5  are linear expressions.

The general equation for a quadratic is: 
a x2 + bx + c,    where a, b, c are constants.


This is the shape of the simplest quadratic equation:


This is the graph of y = x2

In this parabola y-axis is the axis of symmetry, and O is the turning
point. This is a cup-shaped parabola.


Let's consider   -x2-2x+ 3  expression. This is a quadratic expression, the coefficient of x2 is  -1 , and we know the  graph of  a quadratic expression is a parabola.


Now let's look at the shape of  y = -x2-2x+ 3 .


This is a hat-shaped parabola.The axis of symmetry is x = -1 , and the turning point is (-1,4)


Quadratic equations can be found in many everyday situations.
eg.

  • Curves in bridges and buildings

  • Satellite dishes used in telecommunications

  • The path of a golf ball

  • The path of a javelin


Examples

Example 1:
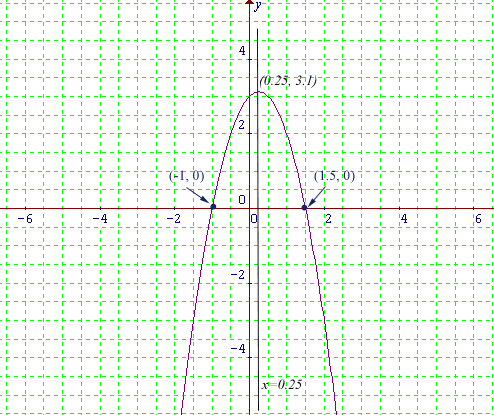
 Plot -2x2+x+ 3, then  find the turning point and the axis of symmetry from the graph.

When plotting a graph, the information below could be useful.

  • Use  graph paper or grid paper for accuracy.

  • Use X and Y as variables.

  • Give values to X and work out the values of Y, set these values in a table.

  • Place the axes in the most suitable position, to give the best presentation of the graph.

  • Label the axes.

  • Choose a suitable scale.

  • Plot the points from your table of values.

  • Join the points to give a smooth curve.


    Let's make a table of values for y = -2x2+x+ 3. Let's choose the x values between -2 and+2

  x -2 -1 0 1 2
x × x x2 4 1 0 1 4
Term1 (T1) -2x2 -8 -2 0 -2 -8
Term2 (T2) x -2 -1 0 1 2
Term3 (T3) +3 +3 +3 +3 +3 +3
(T1)+(T2)+(T3) ,       y  = -2x2 + x + 3 -7 0 +3 +2 -3


  This is the graph of    y = -2x2+x+ 3

grquad8.gif (10434 bytes)

From the graph,
the axis of symmetry is x = 0.25,   turning point is (0.25,3.1)


Example 2:
Sketch y = x2- 4x parabola.

Here are some useful hints for sketching a graph.

Sketching a quadratic graph:

  • Graph paper or grid paper are not necessary.

  • The turning(where the parabola turns) points are important.

  • The y-intercepts(where the parabola cuts the vertical axis) are important.

  • The x- intercepts(where the parabola cuts the horizontal axis) are important.

  • Join the points to give a smooth curve.


Now, let's look at these parabolas.

Parabola (1)  with two x-intercepts and a  y-intercept .

Parabola (2) with one x-intercept  and a y-intercept .

Parabola (3) with no x-intercepts but there is a y-intercept .


Let's sketch  y = x2- 4x,
First, let's find the intercepts.
To find the y-intercept, substitute x = 0 in 
y = x2- 4x,   when x=0 , y =0

To find the x-intercept, substitute y = 0 in y = x2- 4x, 
                                                       x
2- 4x = 0 , we can factorise the equation.

                                                  x ( x - 4 ) = 0
                                               x = 0  or  x - 4 = 0
                                               x = 0  or  x = 4
The graph passes through (0,0) and (0,4). The axis of symmetry should be halfway between them.


So, the axis of symmetry  is   x = 2,    To find the turning point substitute x = 2 to the expression and find the value of y .                              y = x2- 4x
                   
when     x = 2,  y  = 4 - 4×2  = 4 - 8 = - 4
The turning point is (2, - 4)
Now we can sketch the graph.

This is the graph of  y = x2- 4x


Return to Top of Page


Have a Go

Problem 1
Look at the three graphs of parabolas and state the turning points of each and comment on the relationship between them.

See Solution


Problem 2
Consider the three graphs of parabolas and state the turning points and the axes of symmetry and comment on the relationship between them.


See Solution


Return to Top of Page


Practice Questions

Question 1
Are these parabolas shaped like a cup or a hat?
(a)
y = - x2- 4x + 1
(b)  
y = x2- 3x - 2
(c)
y = ½ x2 + x


Question 2
The turning point of
y = x2  is (0,0).
What is the turning point of y = (x - 5) 2


Question 3
Find the x-intercepts of the following parabolas.
(a) y = (x + 1)(x -2)
(b) y = x2 - 3x +2


Question 4
Sketch the graph of y = 16 -  x2


Click to see answer

Return to Top of Page


Solution 1

Look at the three graphs of parabolas and state the turning points of each and comment on the relationship between them.


Equation Turning Point
Parabola (1)   y = x2 ( 0,0 )
Parabola (2)  y = x2 + 2 ( 0,2 )
Parabola (3) y = x2- 3 ( 0, -3 )


Parabola (2) was shifted two units up compared to parabola (1).
Parabola (3) was shifted three units down compared to parabola (1)

In general, we can say  y = x2 + c is a transformation of y = x2
If  c > 0 , the parabola y = x2 being shifted c units upwards.
If  c < 0 , the parabola
y = x2 being shifted c units downwards.

back to Have a Go


Solution 2
Consider the three graphs of parabolas and state the turning points and the axes of symmetry and comment on the relationship between them.


Equation Turning Point Axis of symmetry
Parabola (1) y = x2 y = x2- 4x (0,0) y axis or x = 0
Parabola (2) y =(x + 2)2 (-2, 0) x = -2
Parabola (3) y =(x - 3)2 (3, 0)   x = 3

Parabola (2) was shifted two units left compared to parabola (1).
Parabola (3) was shifted three units right compared to parabola (1).

In general, we can say     y =(x + b)2 is a transformation of y = x2
If  b > 0 , the parabola   y = x2 being shifted b units to the left of y axis..
If  b < 0 , the parabola
y = x2 being shifted b units to the right of y axis.


back to Have a Go

Return to Top of Page


Answer to Question 4


Back to Questions

Return to Top of Page


[Home][General][Business][Engineering][VCE][Learning Units][Tool Box][Glossary]