Ordered pair
- Any two numbers where the order is important
For example, (2,3) is an ordered pair. It gives the location of the point.
The point A is located 2 units in the x-direction and 3 units in the y-direction.
The point B is located 1 unit in the negative x-direction and 2 units in the negative
y-direction.
In other words, in an ordered pair, the first number gives the number of units
along the x-axis and the second number gives the number of units along the y-axis.
Relation -
A relation is a set of ordered pairs, can be set out in a table or can be listed as a set
of ordered pairs.
For example:
This is a relation set out as a set of ordered pairs.
{(1,5) (2,10) (3,15) (4,20) (5,25)} is a relation.
The same relation can be set out in a table.(as below)
| x |
1 |
2 |
3 |
4 |
5 |
| y |
5 |
10 |
15 |
20 |
25 |
The domain of the
relation is {1, 2, 3, 4, 5},which are the first-named numbers.
The range of the
relation is {5, 10, 15, 20, 25}, which are the second-named numbers.
The rule or equation
is how the numbers are related to each other.
In the above relation, we can write the rule as, y = 5 × x or
y = 5x.
This is a linear relationship.
x-intercepts are where the graph cuts the x axis.
y-intercepts are where the graph cuts the y axis.
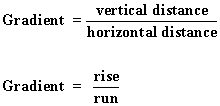
The gradient of line AB is the slope of the line, which is equal to the
ratio between the
vertical distance(rise) and the horizontal distance(run).

Vertical distance = 5units,
Horizontal
distance = 3units
rise = 5units,
run = 3units

